
← All research Inference tracing
Where does the time go when you ask vLLM a question on a DGX Spark?

We wanted to know where the time goes when you send a prompt to a model running on a DGX Spark, from the moment the client sends the request to the moment it gets the first token back. So we built something that follows one request all the way through, and we wrote down everything it showed us, including the places where we got it wrong first.
We ran Qwen3-14B in bf16 on the GB10 chip with unified memory. The server was vLLM 26.05 from NVIDIA's container, with async scheduling and CUDA graphs on.
The short version#
- About 120 ms of every decode step that we first read as unexplained time was the GPU working through the step before it.
- Of the 155.2 ms it took one request to get its first token, 143.3 ms was GPU work.
- A long prompt arriving next to short chats raised their p99 time to first token by 59.2%.
- Capping the prefill slice at 256 tokens in those steps cut that p99 by 18.2%.
What we mean by a step#
vLLM runs as two parts. The frontend takes the HTTP request and turns it into token IDs, and a separate process called EngineCore owns the scheduler and the GPU worker. A request enters EngineCore at admission and waits there until the scheduler picks it.
A step is one round of the EngineCore loop. The scheduler decides which requests run and how many tokens each one gets, and that decision is handed to the executor as a SchedulerOutput. The executor runs the model forward once over the whole batch, and the sampled tokens come back as the output of that step.
With async scheduling on, EngineCore calls execute_model with non_block=True and gets a future back. It can start scheduling the next step while the GPU is still busy with this one.
For that reason we start a step when the SchedulerOutput goes to the executor, and we end it when the future finishes and sampling returns. This is the patch we put around that call:
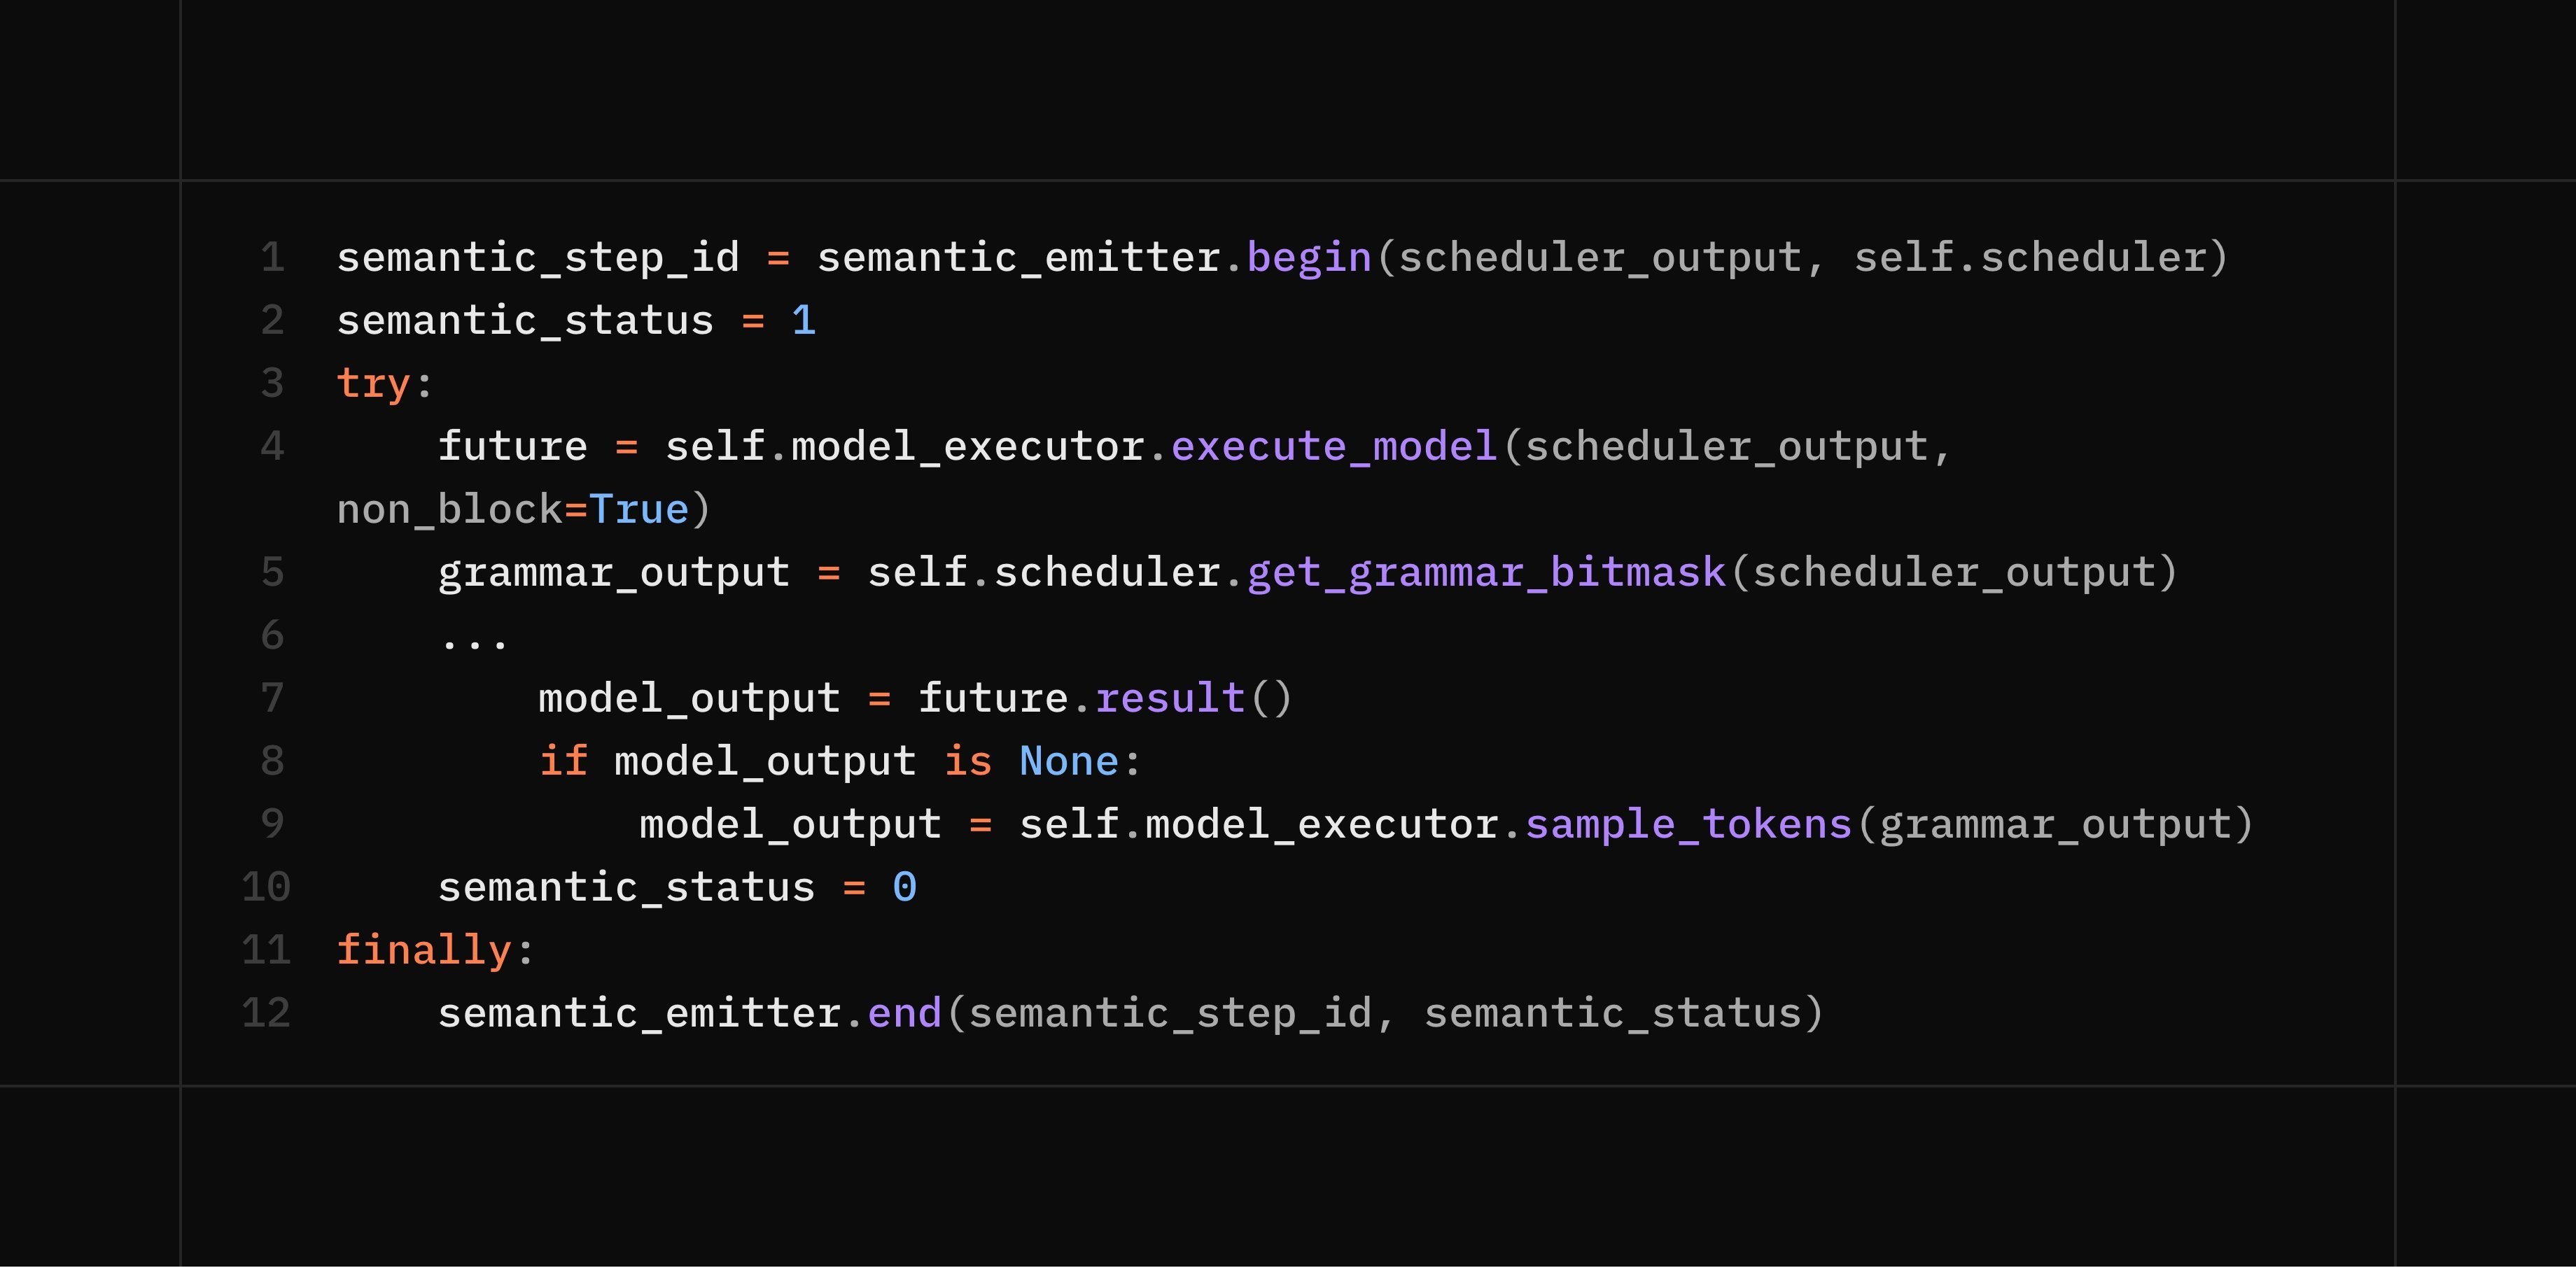
One request with a 94-token prompt and 12 output tokens went through 12 of these steps. The first step handles the prompt and produces the first token, and each of the other 11 produces one more.
Watching from one side#
The first thing we tried was to watch the CPU launch CUDA kernels and add up the time. That told us when the CPU handed work over, but it said nothing about when the GPU started and finished each kernel. We ended up with a gap of around 120 ms per decode step that neither side could explain. The CPU said it was done, and the GPU kernels did not add up to the step time either.
So we needed to watch both sides at once, and we needed a way to tell which events belonged together.
How we tied the events together#
We recorded four kinds of events and joined them.
- Semantic events. A small patch in vLLM marks the start and end of every engine step, and records which requests are in it and how they are packed into rows. The end marker is emitted from a
finallyblock, so a step that raises still closes. - CUDA API calls. Every launch the CPU makes, caught through CUPTI, which is NVIDIA's profiling library.
- GPU kernel activity. What actually ran on the GPU, with start and end times, also from CUPTI.
- Correlation IDs. CUPTI tags each API call and the kernel it caused with the same ID. That is how a launch on the CPU gets tied to a kernel on the GPU.
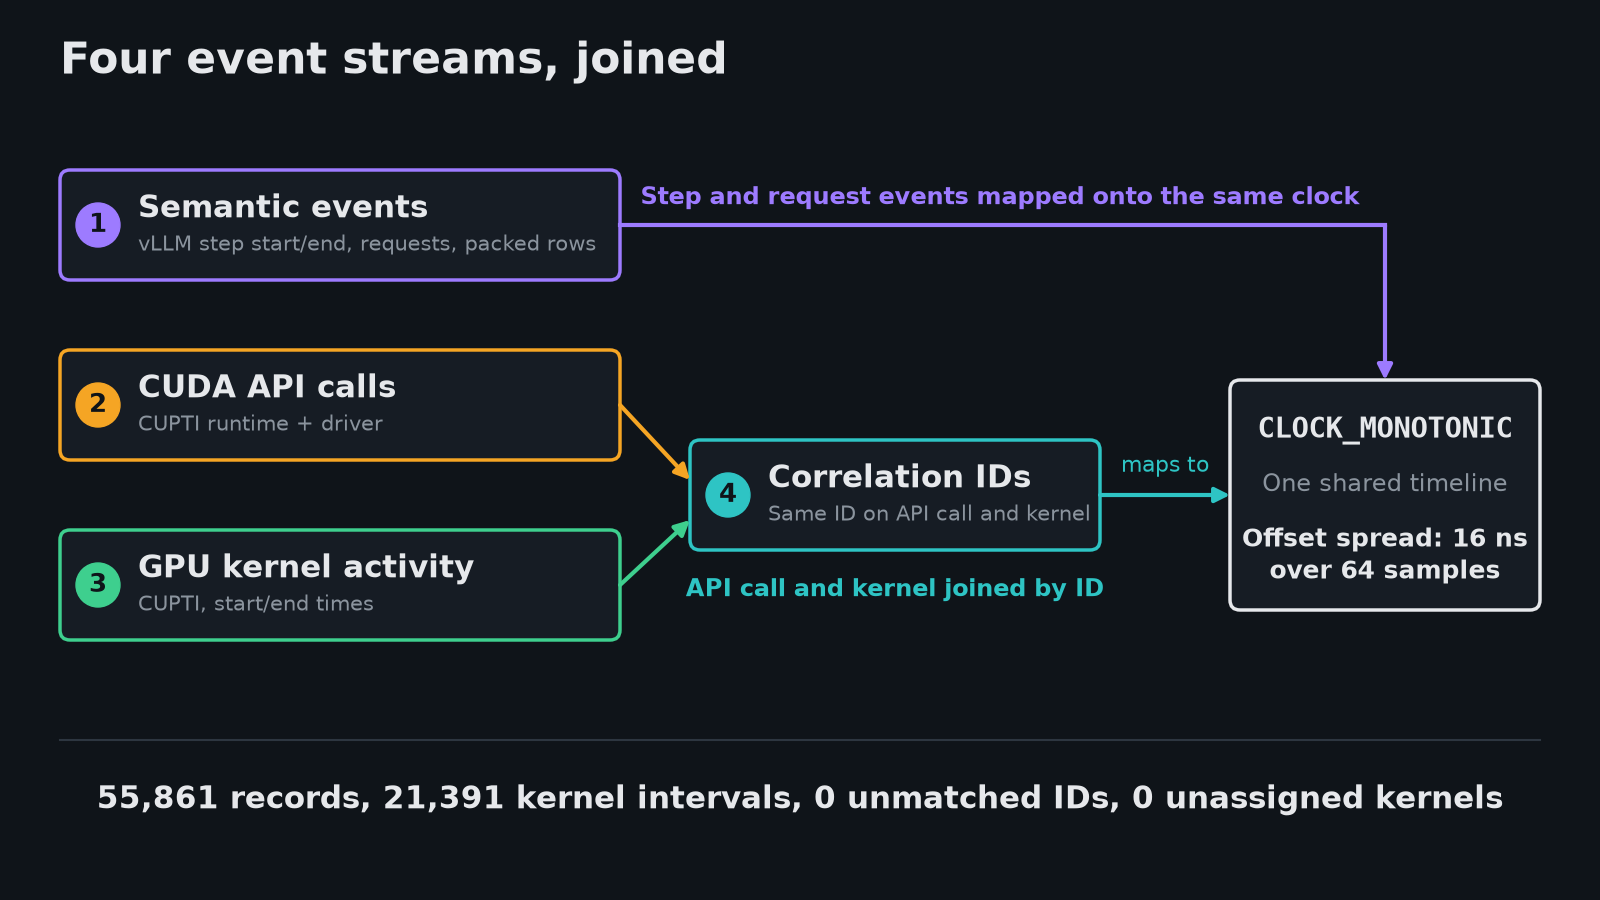
The CPU and the GPU also keep different clocks, so we mapped the CUPTI timestamps onto CLOCK_MONOTONIC with a measured offset. Over 64 sample pairs the offset moved by 16 ns, with an uncertainty of 8 ns at best. That is small against a step that takes 8 to 13 ms.
Two things broke along the way, and both taught us something.
The first was an empty ring. Our step probe recorded zero events even though the code was fine. The NVIDIA container turns on async scheduling by default, and our patch sat on EngineCore.step, which async scheduling skips. It still looked alive because the launch hook caught 1,143 launches. We fixed it by moving the end of a step to mean "the future finished".
The second was 792 missing kernels. Our first pilot only watched the CUDA runtime API, and 792 ordinary kernels were launched straight through the driver API, so they never showed up. We turned on both runtime and driver activity and every kernel got assigned to a step. The run had 55,861 records and 21,391 kernel intervals, with zero unmatched correlation IDs and zero unassigned kernels.
We also kept two sums apart on purpose. One is the total duration of every kernel, and the other is the time the GPU was busy at all, with overlapping kernels counted once. Mixing the two is an easy way to fool yourself.
The 120 ms we couldn't find#
With the join working we looked at decode steps, and the median step took 241.2 ms.
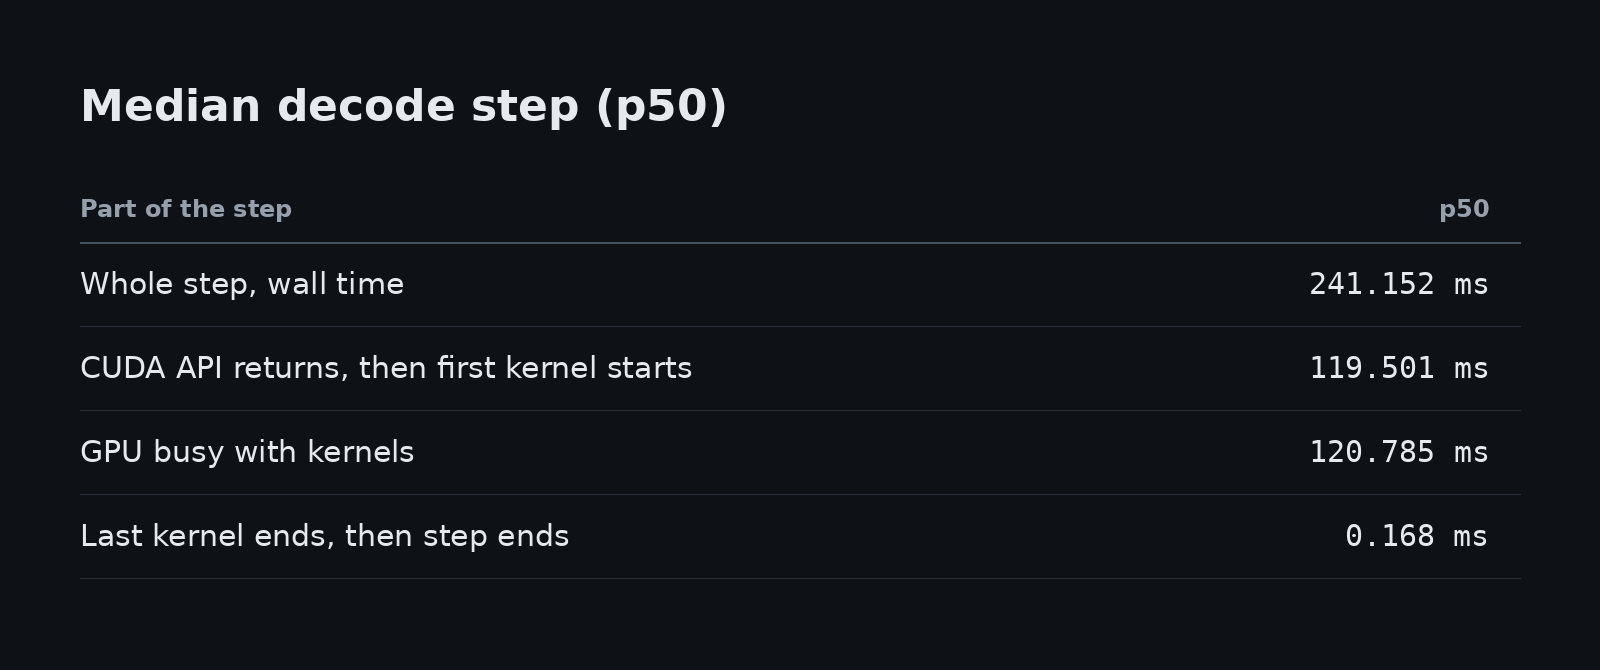
The kernels were busy for about half of the step, and for the other half the GPU was waiting. The reason is async scheduling. The CPU hands over step n+1 before step n has finished, so the new kernels line up behind the ones still running.
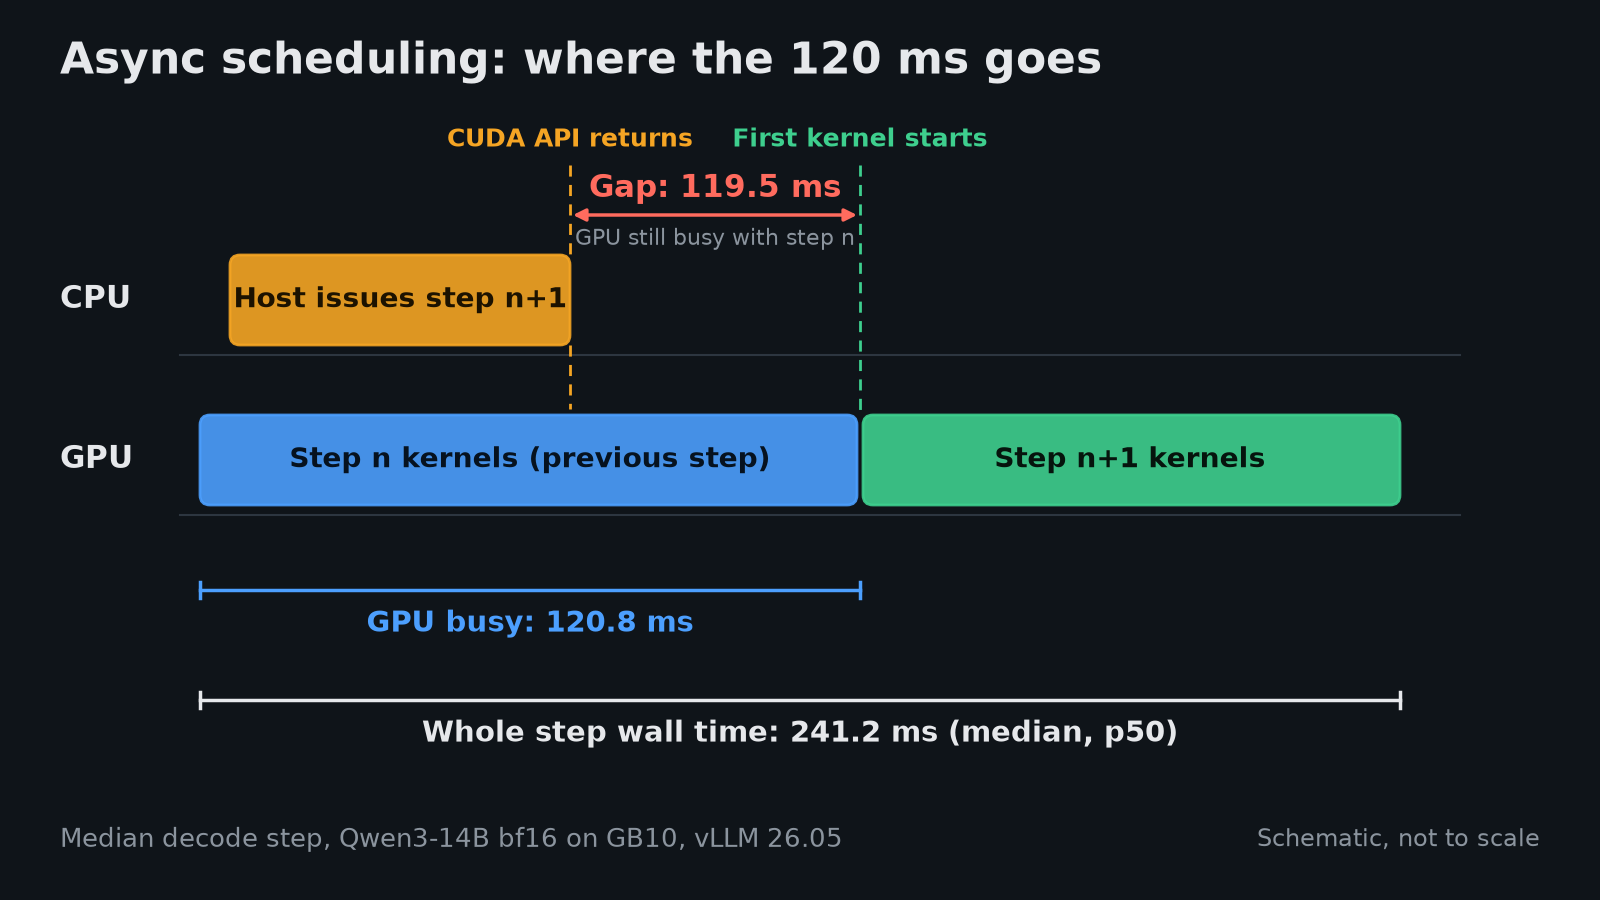
Our earlier measurement had only caught the host handing work over, while the step's wall time covered the whole future. CUPTI showed the stretch between them. The GPU was working the whole time, and the missing 120 ms went to the step before.
One request, start to finish#
Next we followed a single request, a 94-token prompt with 12 tokens back. The token IDs matched at three places: when the engine accepted them, when the frontend streamed them, and when a Rust client received them. All 6,340 kernels across the 12 steps were assigned, with zero loss.
This is where the 155.2 ms to first token went.
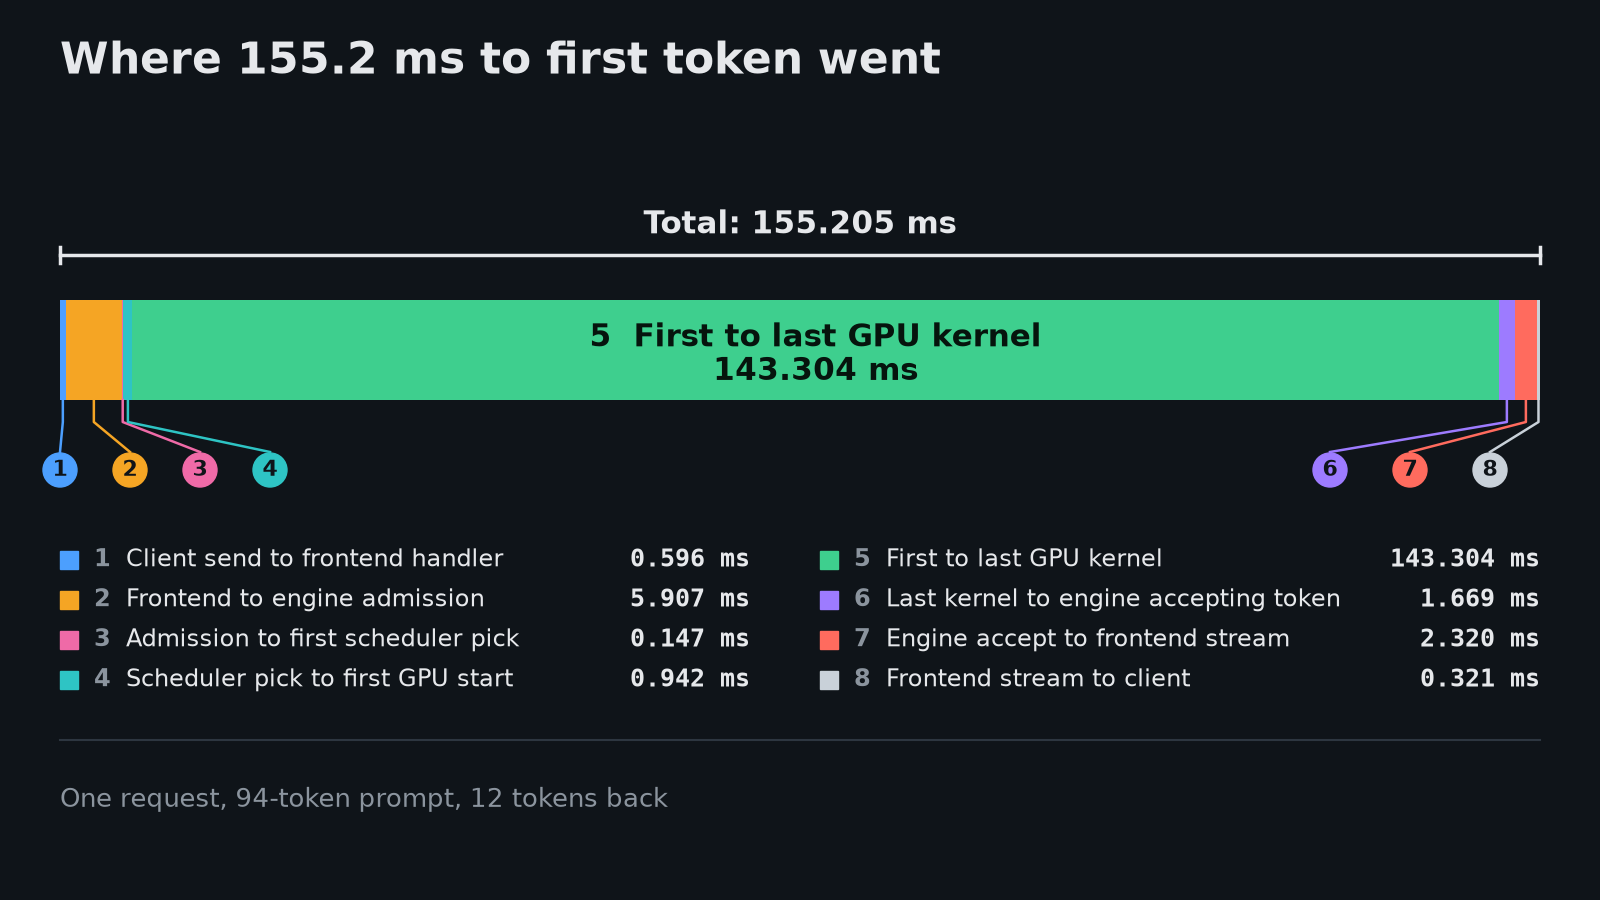
About 12 ms goes to everything outside the GPU, and the rest is the GPU running the forward pass. One caveat is that "frontend entry" is after HTTP and JSON decoding, and "stream" is before the bytes leave the process. This was also a single request, so it says nothing about queueing under load.
Across the whole 38-step trace, 98.84% of kernel time was matrix multiplication and attention took 0.41%. That holds for this model, this chip and short contexts, since attention's share grows as the context gets longer.
The thing that kept showing up#
Once every step was visible, one pattern kept coming back. When a long prompt arrived while short chats were running, those chats got slower at the tail.
We tested it with five fresh servers and a frozen random arm order. One arm ran 100 interactive requests at concurrency 8 with exactly 128 output tokens each. The other arm ran the same requests plus 45 long prefill requests injected every four seconds.
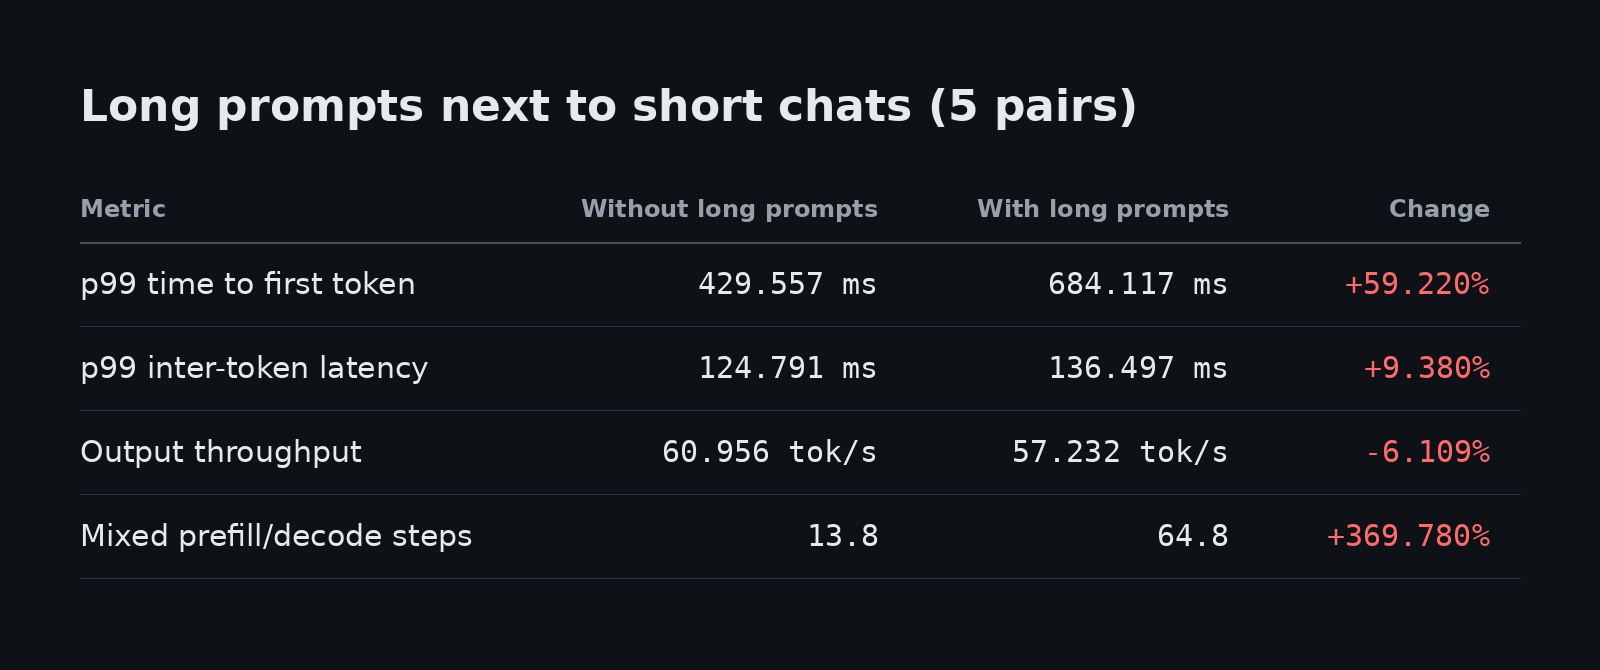
All five pairs moved the same way. A two-pair pilot before this was thrown out because compilation overlapped the measurement, and it is still in the archive.
One rule#
We wanted the smallest fix we could explain in one line, and this is it.
active decode requests exist and a prefill slice is bigger than 256 tokens -> cap the slice at 256 for this step -> do the rest in later steps
The workload and server settings stayed the same and only the cap changed. Every time the rule fired it was logged. The biggest prefill slice in a mixed step went from 1,032 tokens without the cap to 256 with it.
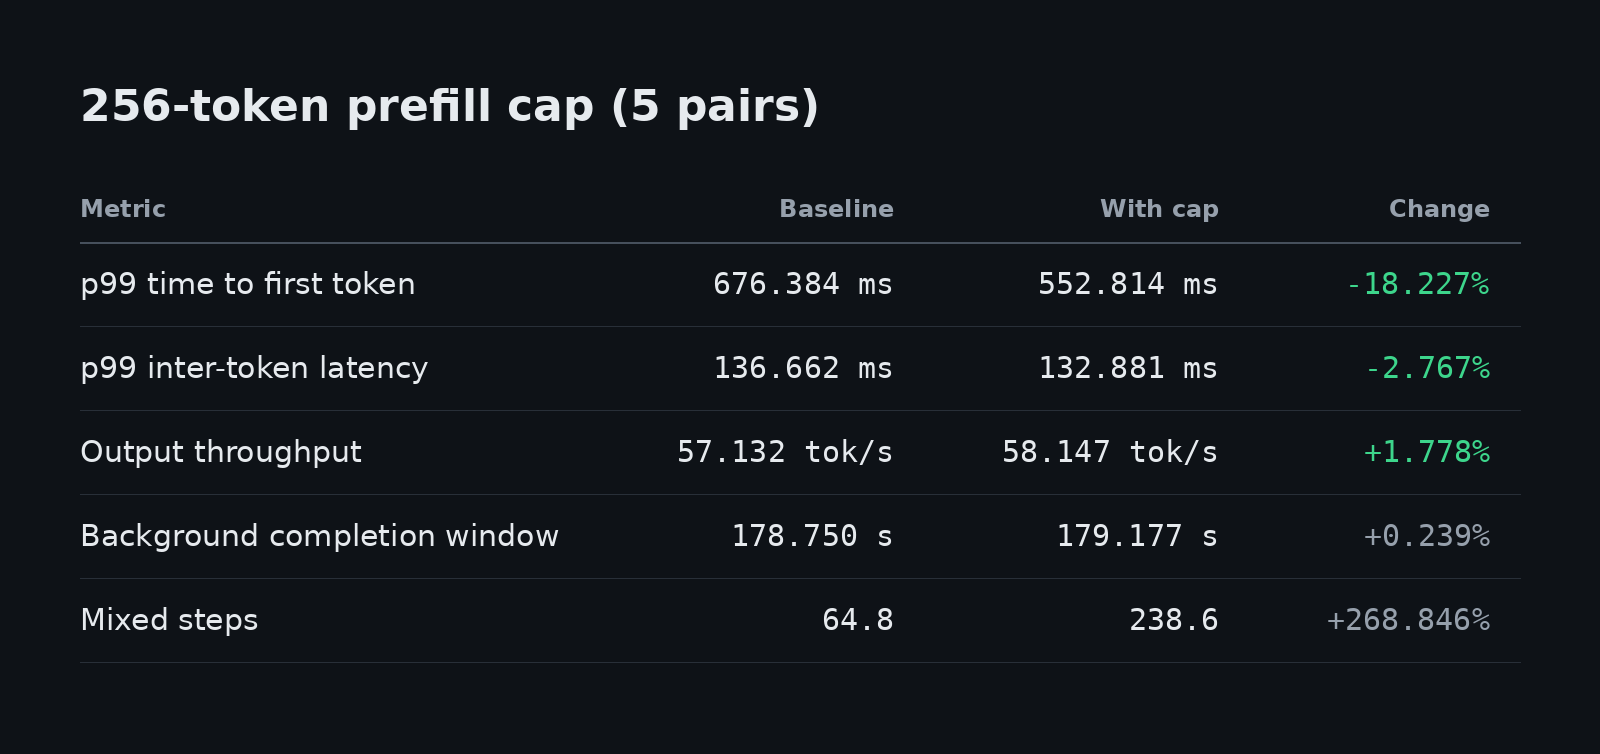
The last row is the interesting one. The cap makes more mixed steps and the tails still got better, so the count of mixed steps tells you little, and what is inside the step and what it costs tells you more.
Our first checker actually said the cap failed. It required every prefill slice in the controlled arms to be 256 or smaller, and the raw traces had slices of 263 and 519 tokens. Those only appeared after the interactive requests had finished, when the rule's condition was already false. We fixed the checker to look only at steps with decode tokens and re-ran it on the same raw trace, without rerunning any inference. The original verdict is still in the archive.
What we can't say yet#
- Five pairs can't get a sign-test p-value below 0.0625, so the paired-t interval holds up but a distribution-free guarantee needs more pairs.
- Mean time to first token did not clearly improve, while the tail did.
- We only tried one cap, 256, so we don't know if it is the best.
- The runtime has no foreground or background label for requests, so long prompts stand in for background work.
- All of this is one model on one chip.
Going one level deeper#
We also tried to go below the kernel and tell which request a single memory access belongs to. For one kernel it works. vLLM's bf16 cache write kernel (reshape_and_cache_flash) has a clean row per token, so with Compute Sanitizer we sampled loads and stores and tied them to request-owned rows and exact SASS offsets. That gave us five instruction offsets, nine requests and 14,363 samples.
It took 59.8 million callbacks to keep those samples, so we use it as a microscope for a chosen kernel and it is too heavy to leave on. GEMM and attention need their own mapping, since one block there touches many tokens.
The first way we tried to find the request for a block was to ask the scheduler what order it planned to pack requests in. That was wrong for 8 of 8 requests in one round, because a cleanup step moved the last request into a freed slot. The real layout is only known where the model runner finishes packing. When we read it from there, the same test showed zero mismatches over 58,400 block events.
What's next#
These are the experiments already written down in our notes, and each one follows from a gap in this article.
- Mixed batches with different context lengths. Our attention measurements so far come from one request at a time, so we will run batches of 2 and 4 with deliberately different contexts and check whether each attention block maps exactly to a request's rows.
- Attribution by share. We will compare equal, token-weighted, context-length-weighted and operation-aware splits of a mixed batch against the same requests run alone, and report median and p95 error on batch compositions we held out.
- Graphs versus compile. Removing eager mode turns on CUDA graphs and
torch.compiletogether, so a 36.1% drop in GPU time that we measured belongs to both. We still need the three-way split of eager, compiled without graphs, and compiled with graphs. - The cost of the observer. We will run clean, semantic-only, CUPTI-kernel-only, selective API tracing and bounded device-probe modes under the same workload, and record p99 time to first token, p99 inter-token latency, throughput, memory and dropped events.
- The 256 cap with more data. That means more pairs, more than one load level, and at least two cap values chosen without tuning on the test set.
- A real service class. We will carry a foreground or background label from request admission into the scheduler output, so the cap applies to declared background work and prompt length stops standing in for it