
← All research Tools
How do you trace inside a GPU kernel when you don't have the source?

We wanted to measure what the kernels inside vLLM do on the GPU, down to which thread blocks run and how often. Most of those kernels arrive as compiled binaries. vLLM ships its own inside a shared library, and cuBLAS, which runs the matrix multiplications, is closed source.
So we patched them after they were compiled.
NVIDIA's Compute Sanitizer lets a tool rewrite a kernel's machine code (called SASS, the instructions the GPU actually executes) at the moment the driver loads it. Three API calls were enough to insert our counter into every kernel that Qwen3-14B runs under vLLM, without the source code and without a rebuild.
On one SiluAndMul launch with 6,098 blocks of 1,024 threads, a counting patch ran 6,244,352 times and made 6,098 atomic adds. Hooking every memory access ran 19,903,872 times, kept 1,048,576 events and dropped 18,855,296. Sampling one access in 1,024 kept about 19,437 events with 0 drops and still counted all 19,903,872 accesses.
The short version#
- Patching happens when a module loads, so it works on binaries we cannot recompile.
- It covers every kernel in the module, and picking the kernels we care about happens later, when we read the events.
- The inserted code never allocates memory and never waits. When the event buffer is full, it counts a drop and moves on.
- Sampling with a hash keeps the access count exact and keeps the buffer from filling.
Where to insert measurement code#
There are three places to put measurement code into a GPU kernel. At source time you edit the .cu file and rebuild, which needs the source. At PTX time you rewrite the intermediate assembly before the driver compiles it, which needs PTX to be shipped, and it is often absent. At load time you rewrite the final SASS as the module enters the driver, which works on any binary.
We took the third path. A module is one compiled GPU binary, and the driver hands it to us after it has it and before anything inside it runs.
The three calls#
Three API calls do the work, in this order:
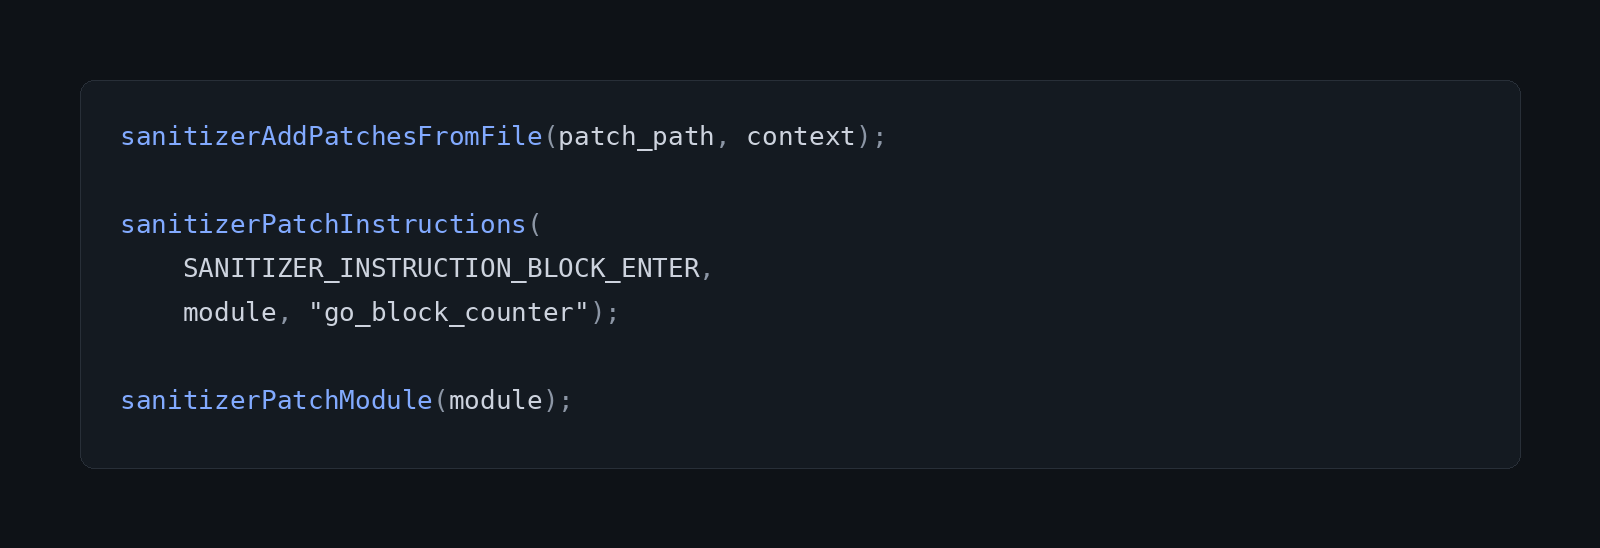
The first call uploads our patch code, once per CUDA context. The patch file is the compiled code of a small set of device functions with no entry point, so it sits in the GPU's memory waiting to be called.
The second call says which instructions get hooked, per module. Read it as "in every function in this module, at every block entry, insert a call to go_block_counter". A block is a group of up to 1,024 threads that the GPU schedules together.
The third call commits the patch. We trigger it from the SANITIZER_CBID_RESOURCE_MODULE_LOADED callback, so the module is patched before anything in it runs. A compare-and-swap on each module's state makes sure it is patched exactly once, even when several modules load at the same time.
What gets patched?#
The unit of patching is the module, so there is no way to filter by kernel name. Every kernel in a loaded module gets the same instrumentation: vLLM's own kernels such as silu_and_mul, rms_norm and reshape_and_cache, PyTorch's kernels, every cuBLAS and cuBLASLt matrix multiplication, and FlashAttention.
Modules load lazily, so the cuBLAS module is patched the first time a matrix multiplication is issued. So we cannot ask to instrument only SiluAndMul. We choose which instruction type to hook and how expensive the hook is, and we pick out the kernels afterwards, using a kernel slot stored on each event or a kernel-name filter in the host subscriber.
What the inserted code has to do?#
Every thread in a block runs the inserted call, because every thread flows through the block's entry point, so we gate the work with a check that only thread (0,0,0), the block leader, goes on. The call is made by all threads, and the work is done once per block.
The leader reads the SM ID and %globaltimer with inline PTX, since CUDA C has no intrinsic for either. We store the raw device timer and make no claim that it equals the host's CLOCK_MONOTONIC, because the two clocks have no fixed offset and treating them as equal would silently corrupt any join between them.
The write path follows 3 rules: never allocate, never block, never wait. Here is the whole path:
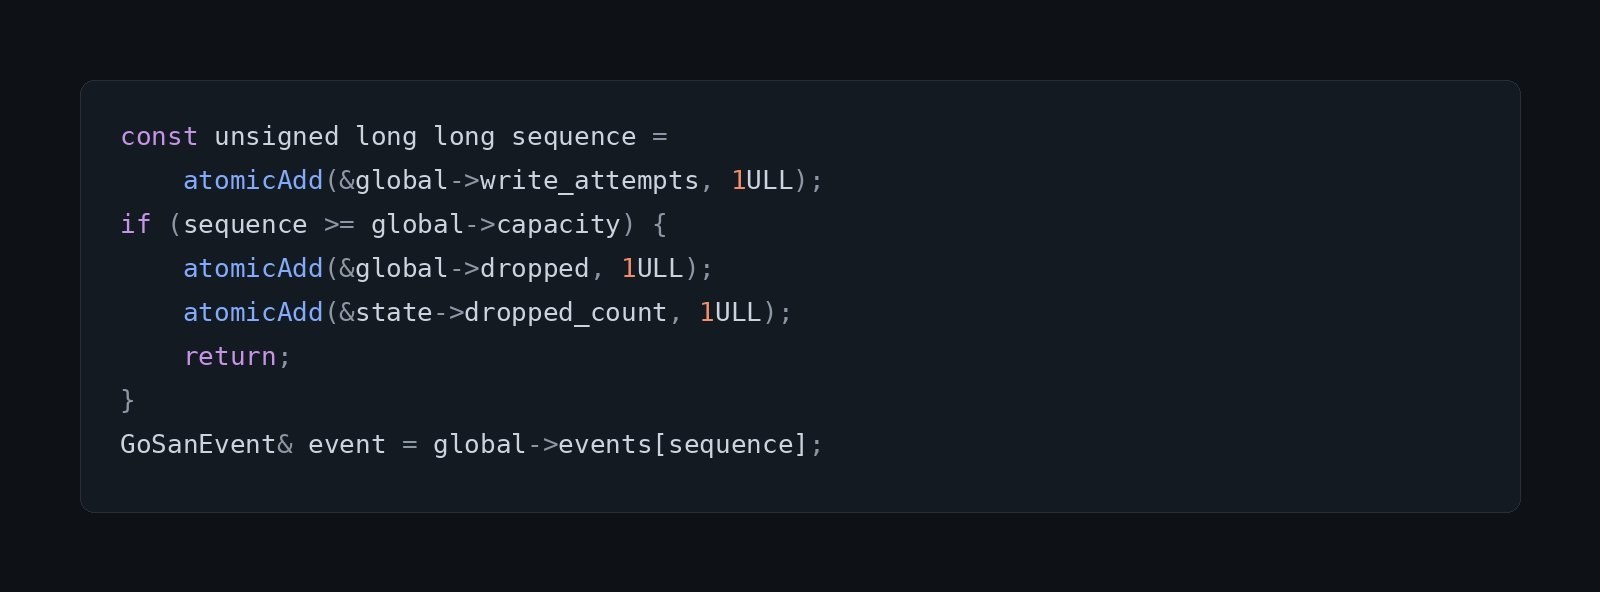
One atomic add, a memory update that many threads can do at once without losing counts, both counts the attempt and claims a slot in the buffer. When the slot number is past the capacity, the thread adds one to a drop counter and returns. Overflow is a counted drop that we can read afterwards.
The buffer holds 1,048,576 fixed 64-byte records, which is 64 MiB per CUDA context, and it is allocated once at startup. The event structure is pinned to exactly 64 bytes with a static assert, so each record fills one cache line and two threads writing neighboring events never fight over the same line.
We chose to drop data rather than disturb timing. A probe that blocked or allocated memory would change the very thing it measures.
Sampling with a hash#
Counting every access is expensive, so the heavier modes keep only a sample of events. We decide with a hash. The code mixes the instruction address, the thread index and the block coordinates, runs the result through the MurmurHash3 finalizer, and keeps the event when the low bits of the hash are zero.
The hash is there because the low bits of an instruction address and of a thread index have a lot of structure. Instruction addresses step by fixed sizes and thread IDs are consecutive, so masking them directly would sample whole warps together, or one instruction every time and its neighbor never. The finalizer spreads the high bits into the low bits, so the test behaves like a uniform one-in-2ⁿ draw.
The decision also needs no random-number state and no memory traffic, and it comes out the same for the same instruction address, thread and block on every replay. Counting and capturing stay separate as well. The counter goes up on every call before the sample test, so counts are exact and only the captured events are sampled.
A ladder of modes#
We built the modes as a ladder, and each rung adds one cost:
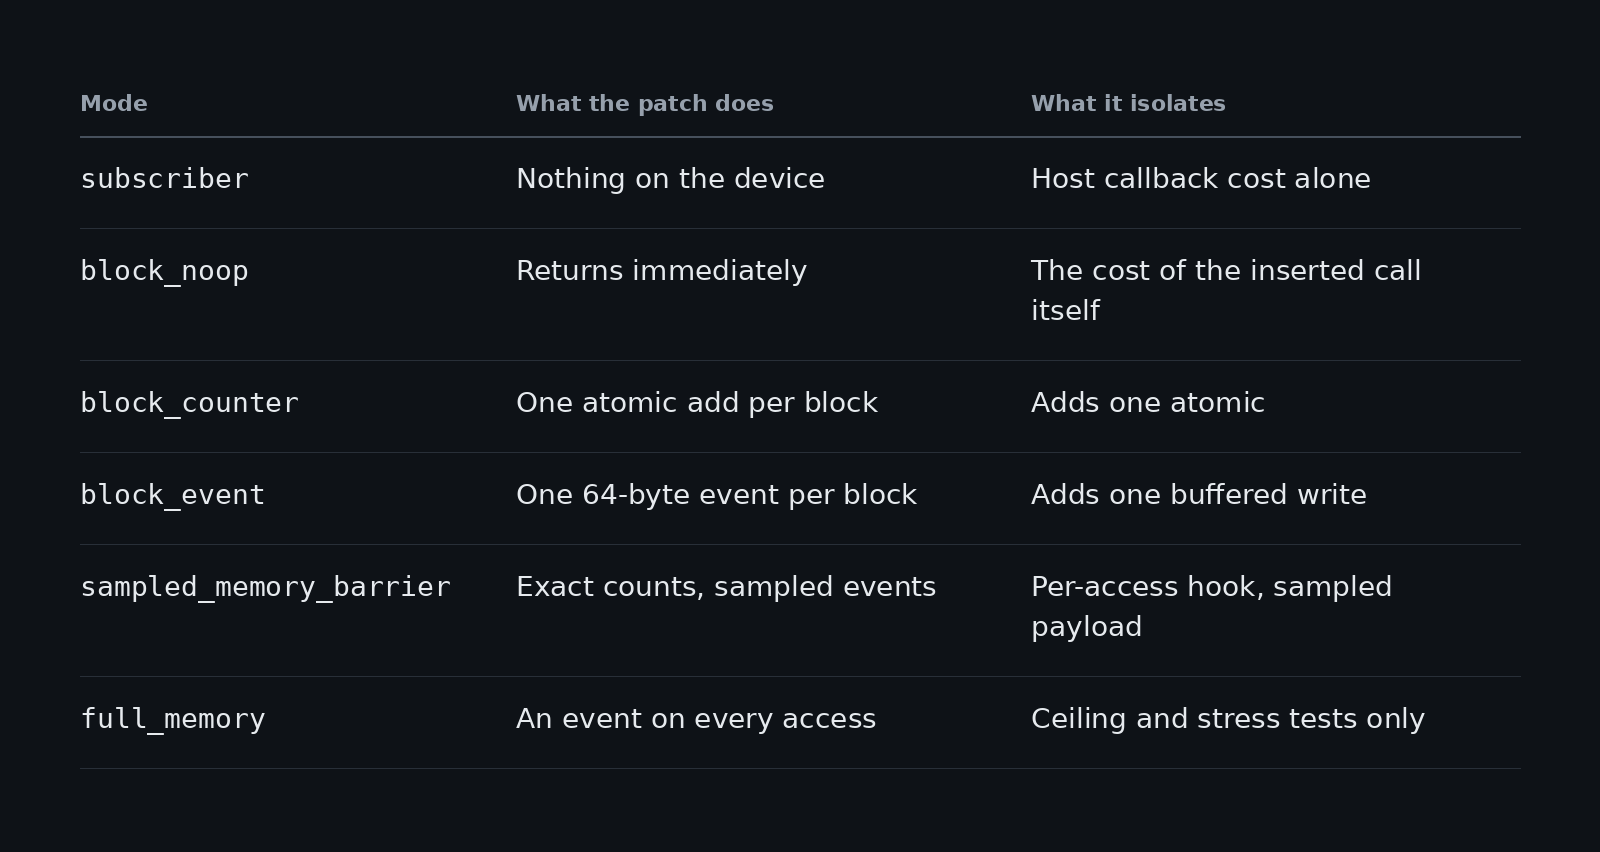
The block_noop patch does literally nothing and exists for one reason: to measure what the inserted call costs before any logic runs. Subtracting it from block_counter leaves the cost of the atomic add alone.
What the counts look like?#
SiluAndMul is a good kernel to try this on, one launch had 6,098 blocks of 1,024 threads, 1,088 vectors per token and 3 global memory accesses per vector, two 256-bit loads and one 256-bit store.
On one SiluAndMul launch with 6,098 blocks of 1,024 threads we got these counts:
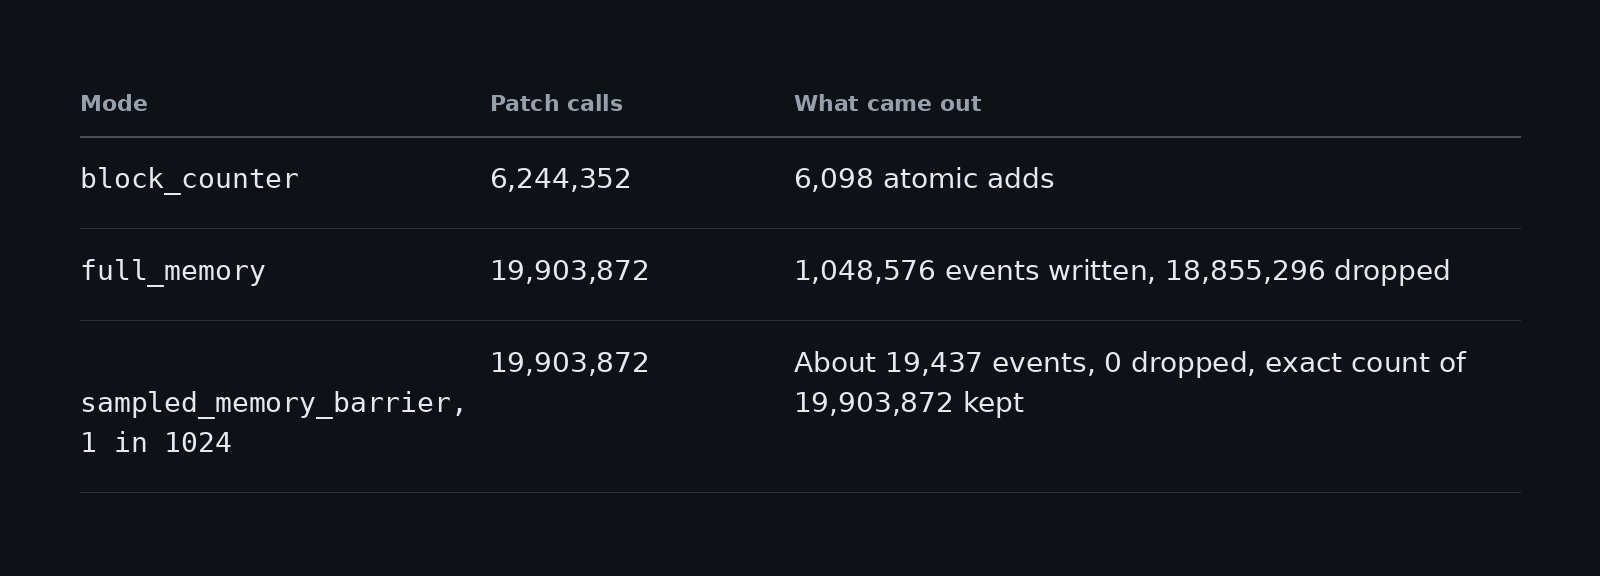
In counter mode the patch ran once for every thread, which is 6,098 × 1,024 = 6,244,352 calls, and only the 6,098 block leaders did an atomic add.
Full memory mode hooks every access, which is 6,098 × 1,088 × 3 = 19,903,872 memory instructions. Each one calls the patch and does two atomic adds on the same address, so about 20 million threads queue at two 8-byte locations. A kernel that should stream memory turns into a queue, and 18,855,296 of the events are discarded anyway. That is why we keep this mode for stress tests.
Sampled mode keeps the exact count of 19,903,872 accesses and writes about 19,437 events, roughly one-thousandth of the buffer pressure. This is the mode we can use on a real vLLM run.
Before you try this on vLLM's decode, one thing to know: decode runs inside CUDA graphs, and under replay the patched code still runs, but data attached to each launch stops working.
Setting GPU_OBSERVER_SAN_CALLBACK_DATA_SCOPE=function binds one stable callback pointer to the patched function, and that fixes it.
What we learned is that load-time patching reaches every kernel in a module without touching its source. It also showed us that the hot path can stay safe with three rules: no allocation, no waiting and counted drops. Hashed sampling keeps the counts exact while the buffer stays small, and the mode ladder gives us a way to separate the cost of each piece.
Some questions remain open. The numbers above are counts and we have not timed the modes in this write-up, so we can't yet say what each rung costs in latency on a real serving run. We also don't know which mode is cheap enough to leave switched on for a live service. So what we can say is that a patch applied at load time reaches every kernel in a module, and hashed sampling keeps the counts exact while the event buffer stays small.