
← All research Inference tracing
How to follow the KV cache writes in one vLLM request?

We wanted to count every gpu thread block that writes into the KV cache while vLLM answers one request, and to know which graph node and which replay each block came from. vLLM replays the same cuda graph for every decode step, so the nodes are the same from one step to the next and only the replay changes.
The model was Qwen3-14B in bf16 on a GB10 gpu, served by vLLM v1 with async scheduling, FULL_AND_PIECEWISE cuda graphs, the FlashAttention 2 backend, prefix caching off and an 8 GiB KV cache. The kernel we instrumented is reshape_and_cache_flash_kernel, which writes each layer's new keys and values into the cache.
Our first probe crashed the engine, and the fix came down to how long a pointer lives. It gave every kernel launch its own pointer to the callback's state, and under graph replay the first callback that read that pointer crashed with a misaligned address. When we attached one fixed pointer to the kernel function, which lives as long as the function does, the same callback ran on all 7 replays without a fault. The final run matched every cache-kernel execution in the request to a graph node and a device event, and nothing was dropped.
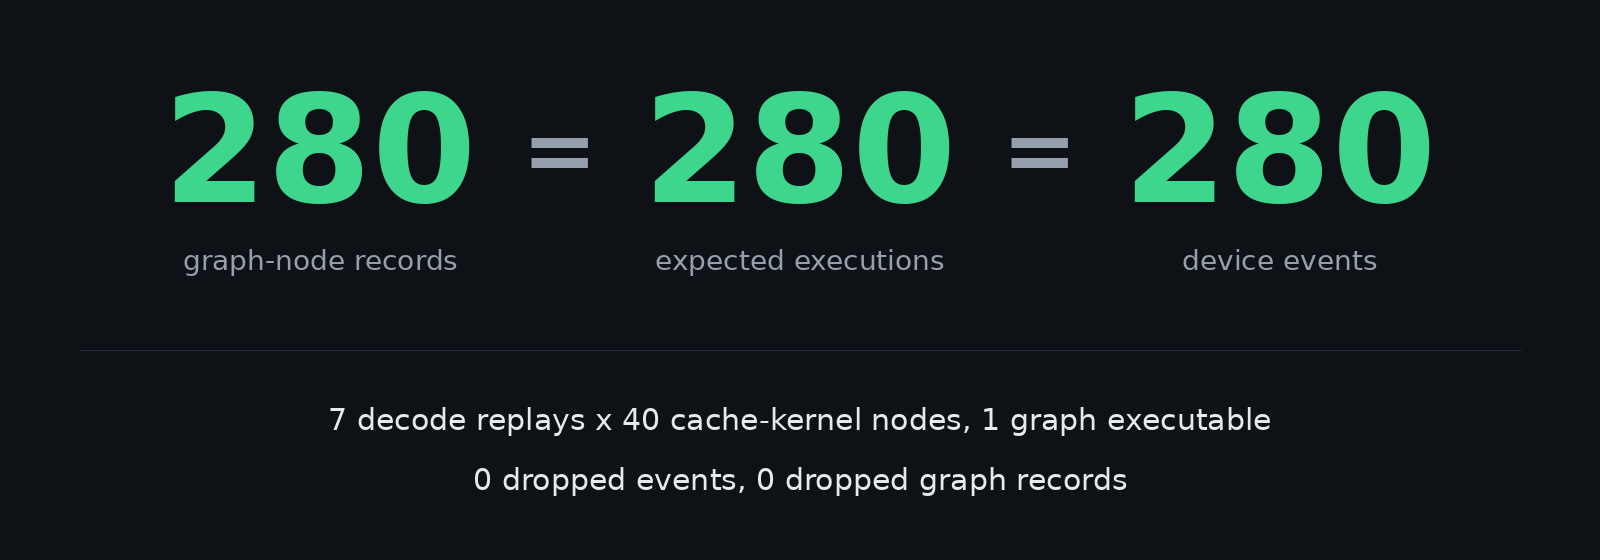
280 graph-node records, 280 expected executions and 280 device events agreed exactly. One graph executable held 40 stable nodes and was replayed 7 times, with 0 drops.
The short version#
- All 280 cache-kernel executions in the request matched a graph node and a device event, with 114,112 block events recorded and 0 drops.
- Attaching new callback data to every kernel launch crashed the engine under replay with a misaligned address error. The request came back as HTTP 500 with zero tokens.
- Giving the callback one fixed pointer for the whole kernel function fixed the crash.
- Within a replay, the first and last layer's cache writes were 106.85 to 108.58 ms apart. Between replays the gap was about 11.4 ms.
What a CUDA graph changes#
A CUDA graph goes through four stages. The module loads the compiled kernel code, capture records the kernel operations and their dependencies, instantiation builds a graph executable with prepared kernel nodes and parameters, replay then runs those existing nodes again.
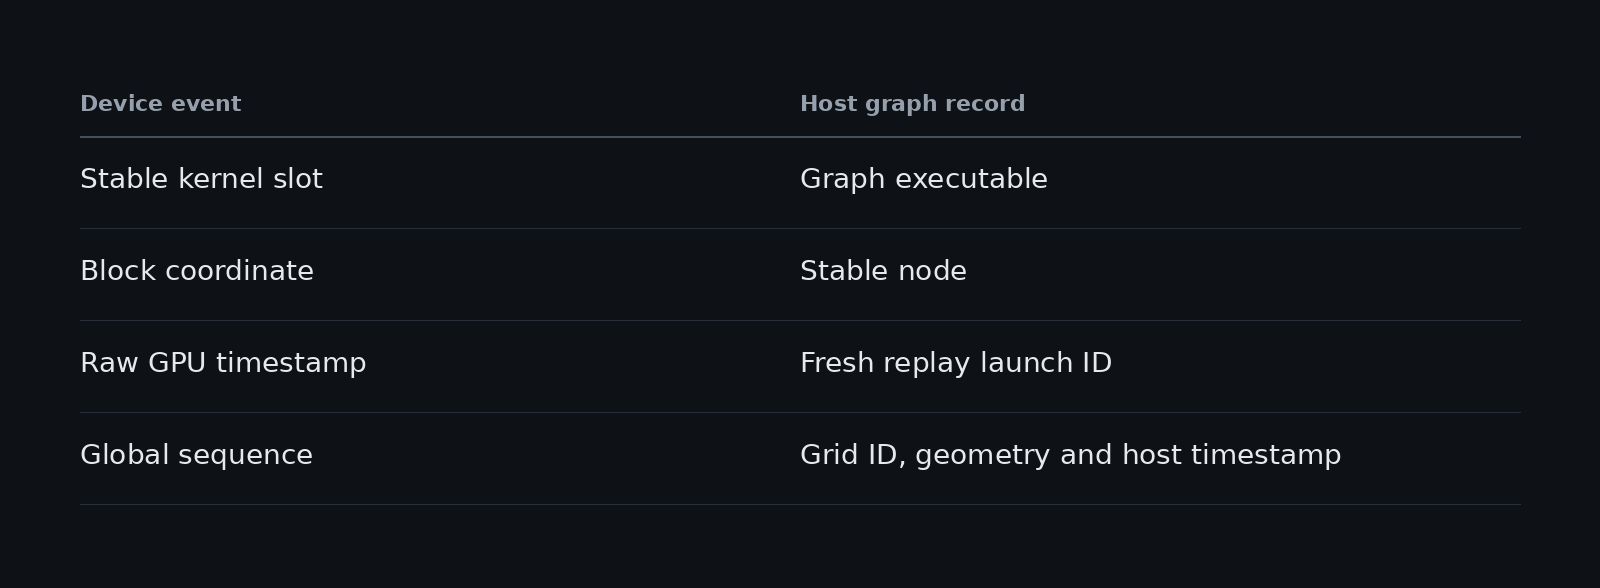
Because the nodes already exist, a replay gives us three stable things to identify a piece of work by. The graph executable is one instantiated graph. A node is one kernel inside it. The replay ID, which Compute Sanitizer calls a launch ID, changes on every replay. So a replayed kernel is identified by all three together.
Anything we attach to a kernel has to survive that reuse and that turned out to matter more than anything else in this project.
The request we followed#
We sent one request that asked for 8 output tokens, after a one-token warm-up. vLLM ran a prefill that produced token 1, then 7 decode iterations for tokens 2 to 8. Each decode iteration replays the graph.
Qwen3-14B has 40 transformer layers, and the cache kernel runs once per layer in decode. Seven replays times 40 nodes gives 280 graph-node executions, which is the number we expected to find at the end
- The HTTP request asks for 8 output tokens.
- Prefill produces token 1.
- Seven decode iterations produce tokens 2 to 8.
- Each decode iteration replays the graph.
- The graph runs 40 transformer layers.
- Each layer calls
reshape_and_cache_flash_kernel. - Our SASS callback runs at block entry.
- The callback counts or records one event per CUDA block.
Three observers#
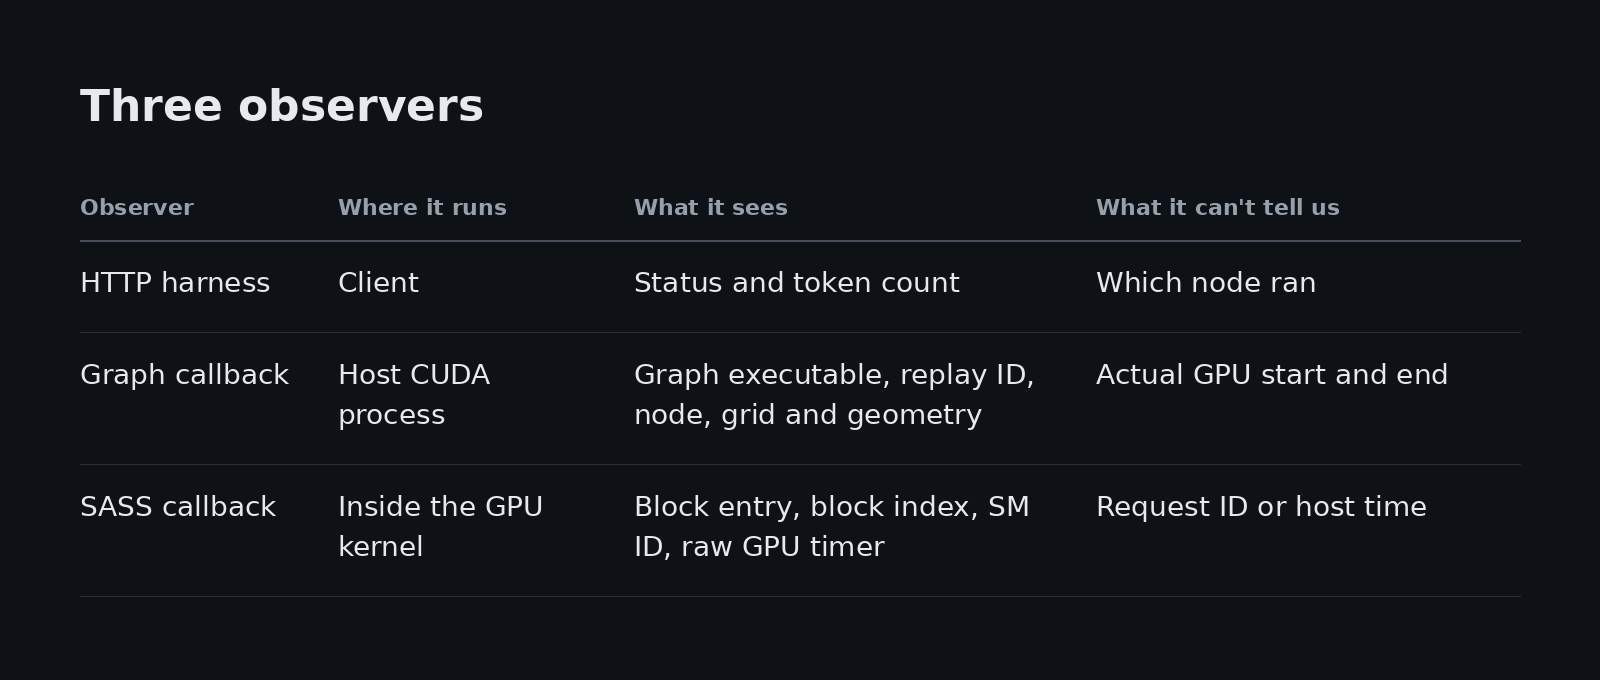
We watched from three places, and each one sees something the others can't. The graph callback stamps events with the host's CLOCK_MONOTONIC, and the SASS callback uses the GPU's raw %globaltimer. So we kept both values and did not subtract one from the other.
The first attempt crashed#
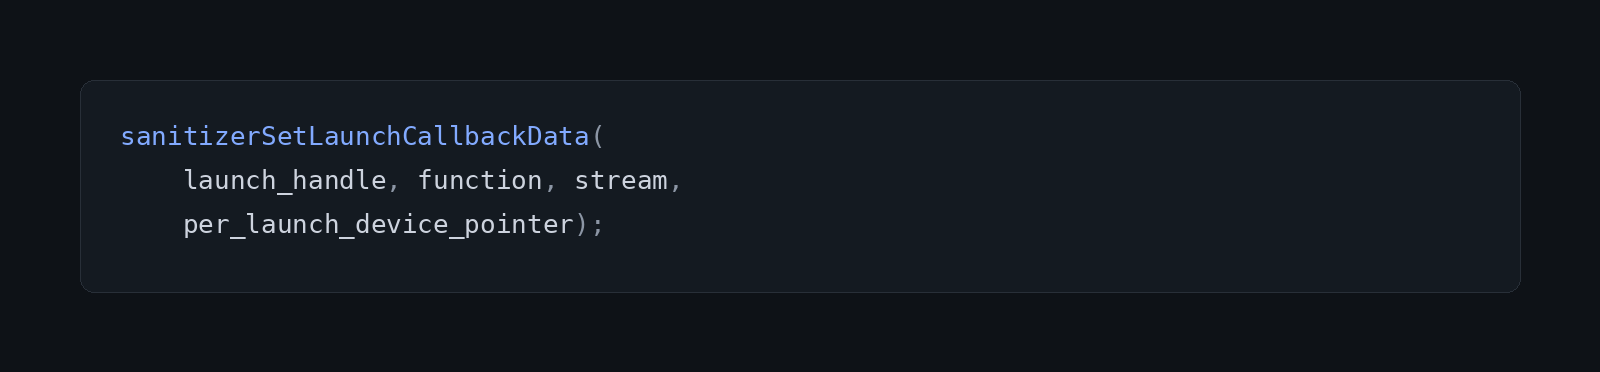
Our first design gave every ordinary kernel launch its own device callback structure, set through the compute sanitizer api like this:
Under graph replay a callback that did nothing passed, because it never read the pointer. The smallest stateful callback, which dereferenced the pointer once and did one atomicAdd, failed with cuda error: misaligned address.
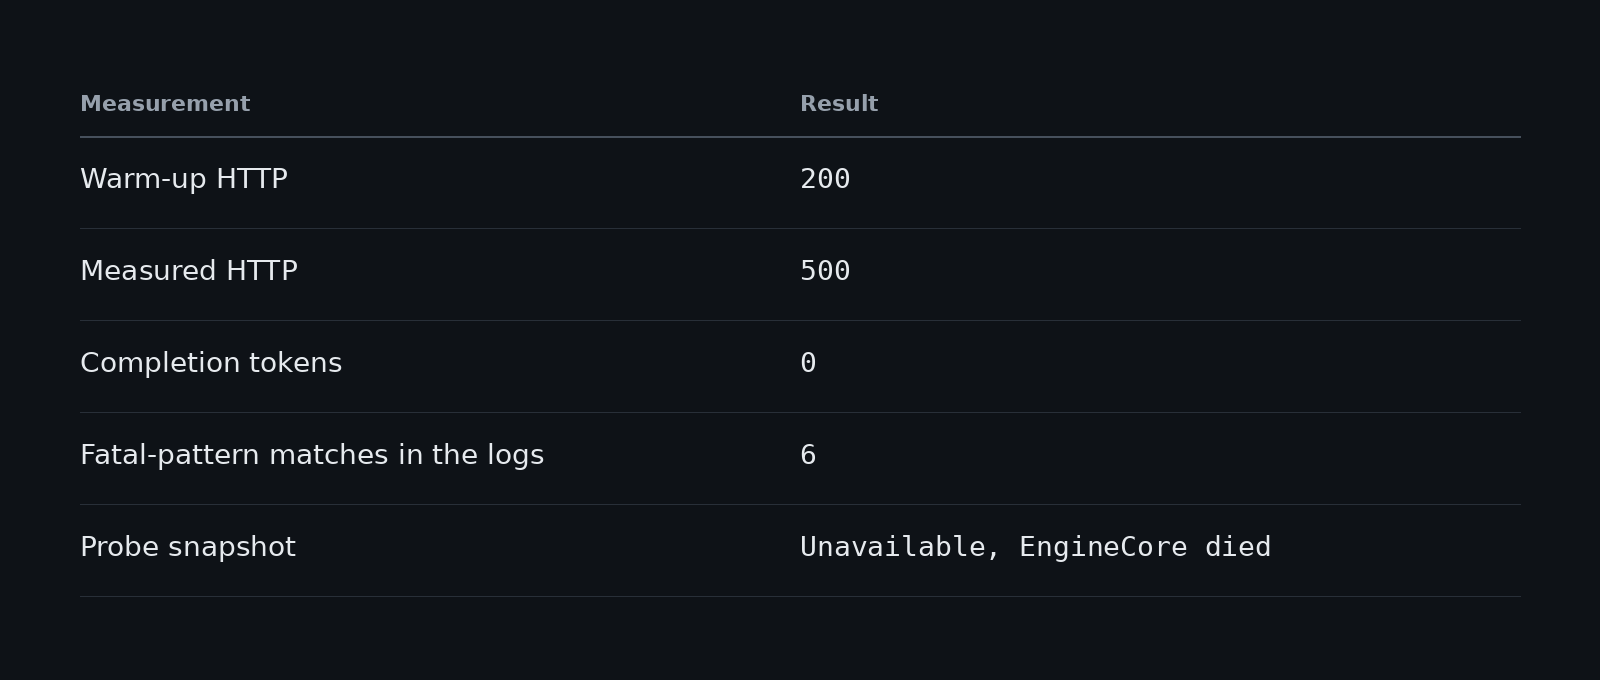
That pointed at how the per-launch data was handled under replay.
First fix: one pointer for the whole function#
We asked whether a stateful callback survives replay when every replay sees the same device pointer, attached once to the kernel function. The host sets up the structures at stable device addresses and calls sanitizerSetCallbackData with the function and that stable pointer. It never changes the pointer between replays.
On the device side only the first thread of each block increments a counter, so one block adds one to the count.
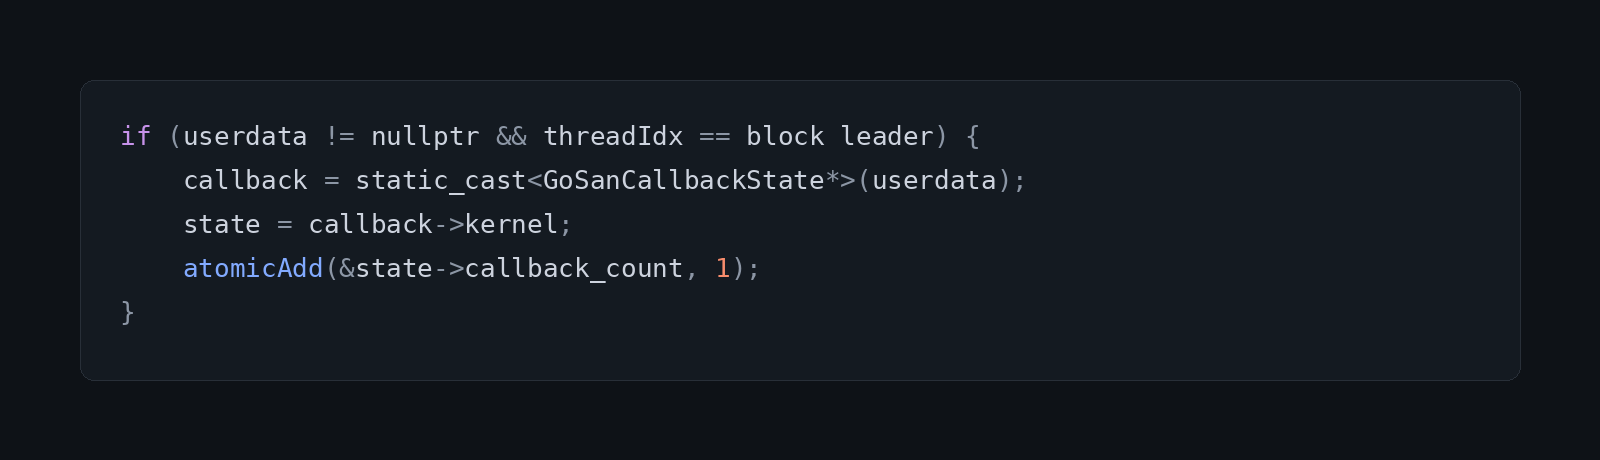
The request returned HTTP 200 with 8 tokens and no CUDA error. We saw 1,320 target launches, and the callback ran 114,112 times with no callback-data failures.
The host geometry predicted 115,880 blocks, so 1,768 blocks were missing. We think the first target launch ran before the module was patched, because the subscriber only recognizes the function when that launch ends. That is an inference until we count the pre-patch blocks directly.
One more detail from this run. Its outcome file says result=fail, because an early version of the harness left fatal_count as an empty string instead of zero. The raw HTTP response, the 8 tokens, the logs and the counters all show a pass.
Second fix: a full event for every block#
A counter says how many blocks ran, but we wanted one record per block. So we extended the callback into a bounded event writer. Each block leader reserves a sequence number with an atomic add. If the sequence is past the fixed capacity, it increments a visible drop counter and returns. Otherwise it writes one 64-byte event.
Each event keeps the raw GPU %globaltimer, the SASS program counter, a stable kernel slot, blockIdx in x, y and z, the callback sequence, the SM ID and the event kind. The buffer holds 1,048,576 events of 64 bytes each, which is 64 MiB per CUDA context, and it is allocated once at startup.
The callback never allocates memory and never makes inference wait for space. The run emitted 114,112 events and dropped none. The event file was 7,303,232 bytes, which is exactly a 64-byte header plus 114,112 events of 64 bytes each.
That ruled out %globaltimer, blockIdx, the 64-byte record, the buffer alignment and the slot-reservation atomic as causes of the crash. What remained was the per-launch callback data.
The events still had a gap, because every one carried launch_id = 0. Rewriting the shared callback structure for each replay would bring back the same lifetime problem.
Third fix: take the replay ID from the host#
The graph callback domain gave us the replay ID without touching the device state. We subscribed to SANITIZER_CB_DOMAIN_GRAPHS and its node-launch-begin callback. For every kernel node that matched reshape_and_cache_flash_kernel, the host copies the graph executable, the replay launch ID, the node, the grid ID, the streams and the geometry into a fixed table, then publishes the entry with a release-store. The table holds 65,536 entries of 96 bytes each, which is 6 MiB.
A full table increments graph_node_table_drops and returns. The device events stay unchanged across replays, and we match them to the host records afterwards.
What the final run showed#
The final run returned 8 tokens with no CUDA error and no drops on either side. One graph executable had 40 selected nodes, and those 40 nodes appeared in every one of the replays numbered 1 through 7. No node repeated inside a replay, and the node order never changed from replay 1.
The 280 device events had sequences 113832 to 114111 with no gaps. They all used kernel slot 4979 and block (0,0,0), they were all block-entry events, and the raw timer never went backwards. They fell into exactly seven consecutive groups of 40.
The 280 graph-node records, the 280 expected one-block executions and the 280 device events agree. So for this single-stream graph, we get an ordered match from device block to graph node to replay.
Inside one replay, the last layer's cache-block entry came 106.85 to 108.58 ms after the first layer's. That span is the whole stack of layer compute between the first and last cache writes, so it says nothing about how long the cache kernel itself takes. From the last cache entry of one replay to the first of the next was about 11.38 to 11.42 ms.
The main thing we learned is that callback data has to live as long as the kernel function when a graph is replayed. Our best reading is that the crash came from data tied to individual launches, because a graph replay runs nodes that were set up earlier. The second thing is that the replay ID can come from the host side, so the device state stays the same across replays and we match the two records afterwards.
Plenty is still open and we don't know what the 11.4 ms between replays is. We can't call it gpu idle time, cpu overhead or synchronization until we have CUPTI kernel start and end times. We haven't tried a graph that runs on several streams, where the order of atomics on the device can differ from the launch order. We also haven't tied a request to its packed rows in the same run, so we can't say which request owned which block. The 1,768 missing blocks are still our guess about the first launch, and we haven't measured what any of this costs in latency or throughput.
Closing thoughts#
From this run we can establish four things. For one request on one stream, every execution of the cache kernel can be matched to a graph node and a replay, because the 280 host records, the 280 expected executions and the 280 device events agree exactly. So we can say which layer's cache write a given block belongs to and which decode step it happened in.
The matching also held with no loss. The device buffer and the host table both finished with 0 drops, and the event sequences ran 113832 to 114111 with no gaps. So the observer recorded everything it was supposed to see, and we can trust its counts.
We also have a working recipe for attaching state to a kernel under graph replay. Callback data tied to the kernel function survived all 7 replays, and the replay ID came from the host through the graph callback domain. So the device side stayed identical from one replay to the next.
Last, the timestamps give a first look at the shape of a decode step. The layer stack takes about 106.85 to 108.58 ms between the first and last cache writes, and the next replay starts about 11.4 ms after the last write of the one before. That is where the open questions begin, because these timestamps tell us when blocks started and say nothing about how long any kernel ran.
If you have put per-launch callback data on kernels under graph replay and hit a misaligned address, we'd like to hear how you handled it.
hit us a follow if you liked this article! @latentone_